Report Builder
The Report Builder is where you shape a report and watch it come together. To start a new report, open the Reports page and click New Report; to change a saved one, open it from the list (see Saved templates).
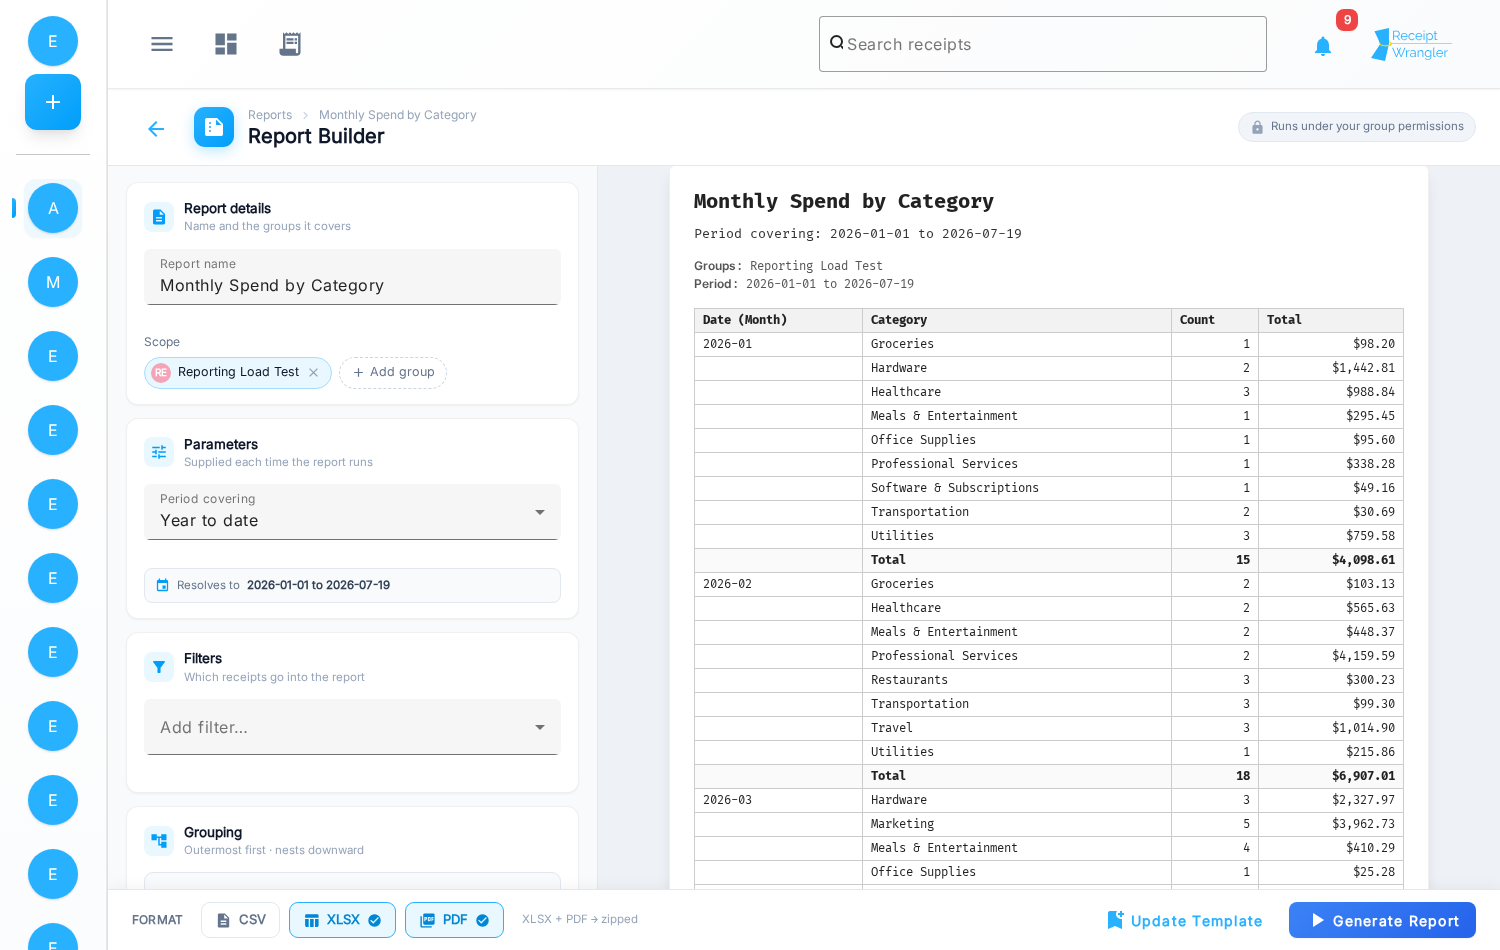
The builder is a full-height, two-pane screen. On the left is the configuration panel, a stack of sections you fill in top to bottom. On the right is a live preview that re-renders as you make changes. A bar pinned to the bottom holds the output-format toggles and the Generate and Save Template buttons.
Report details
Give the report a Name, then set its Scope — the groups whose receipts the report covers. Each
group appears as a chip; use Add group to attach another and the ✕ on a chip to remove it. You can
only add groups where you hold the Read Reports permission (group.reports.read), so the picker only
lists groups you can report over.
Parameters
Period covering sets the date window the report runs over. Choose a preset — This month, Last month, Month to date, Quarter to date, or Year to date — or pick Custom range… to reveal Start and End date pickers. A hint line shows the exact dates the current selection resolves to.
Filters
Filters narrow the report to specific receipts — by status, category, tag, amount, paid-by, and more. Add a filter row, choose a field and an operation, and set a value; add as many rows as you need. These are the same filters you use elsewhere in Receipt Wrangler, so they behave exactly as they do on the receipts list.
Grouping
Grouping levels organize the report into sections and subtotals. Add one or more dimensions — Paid By, Category, Tag, Status, Group, Name, Month, Year, Date, Resolved Date, or Added At — and order them outermost-first; each level nests inside the one above it. Use the up/down controls to reorder a level and the remove control to drop it.
Detail rows
Detail rows decides what a single row of the report represents:
- Records — one row per receipt. The report lists the individual receipts that match.
- Aggregate — one summed row per value. Choose an aggregate by dimension, and the report rolls the matching receipts up into a single total row for each value of that dimension.
Columns
In Records mode the columns are the receipt's own fields. In Aggregate mode you build the columns yourself: a reorderable list where each column carries a small badge for its kind — Dim (dimension), Agg (aggregate), or Formula. Use Add column to open the column picker, and the up/down and remove controls to arrange the list.
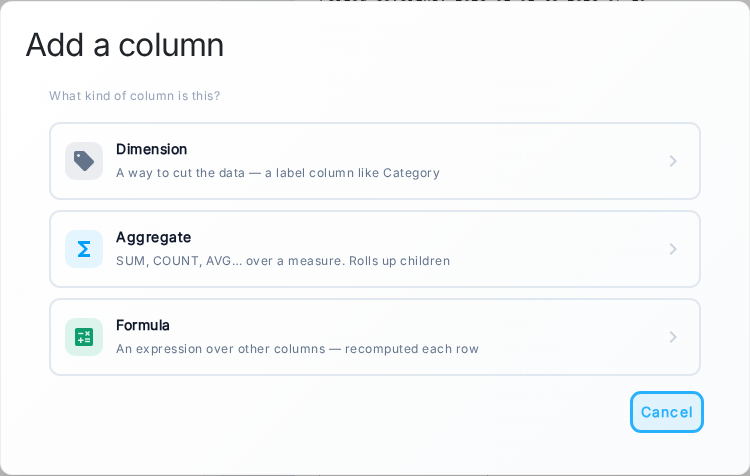
The column picker is a short wizard. First choose the kind of column, then configure it:
- Dimension — a field to label the row by (for example the category or paid-by). Pick the field and give the column a label.
- Aggregate — a calculated value. Pick a function (SUM, COUNT, AVG, MIN, or MAX), the measure it runs over (hidden for COUNT), and a label.
- Formula — a value computed from your other columns. Give it a label and build the expression by clicking columns and operators; the picker shows whether the expression is valid as you go.
A column that doesn't make sense for the current aggregation — for example a dimension that isn't being grouped or aggregated by — is shown greyed out with the reason, rather than being removed. It's left out of the generated report while it's invalid, and comes back automatically once the configuration makes it valid again. Disabled columns are still saved with the template, so they self-heal when you reopen it.
Totals
Two checkboxes control the summary rows:
- Per-group subtotals — add a subtotal for each grouping section.
- Grand totals — add a single total row across the whole report.
Document
The Document section controls the report's presentation. Set a Title and an optional
intro/preamble and footer. In the text fields you can insert variables that are filled in when
the report is generated — {{period}}, {{group.name}}, {{generatedAt}}, and {{currentUser.name}}.
If you leave the title blank, the report falls back to the report's name.
Live preview
The right pane shows a live preview rendered from your actual data, updating a moment after you stop editing. It needs at least a group in scope and one column (and both dates when you've chosen a custom range) before it can render. The preview is sandboxed for safety.
At the top of the preview is a receipt-count chip — click it to open a read-only drill-in that lists the receipts feeding the report, where you can inspect a single receipt's breakdown or open it in full.
Output formats and generating
The bar at the bottom holds the format toggles — CSV, XLSX, and PDF. Pick one or more, then click Generate Report to build and download it (a single file, or a zip when you pick several). Generation runs immediately: the button shows a spinner while the report builds, then the download starts.

Generating a report requires the Generate Reports permission (app.reports.generate) in addition to
Read Reports (group.reports.read) in every group in scope. If your role doesn't grant it, the
Generate Report button won't appear.
Saving a template
The Save Template button (to the left of Generate) stores the current configuration as a reusable template. Saving needs a name in addition to a runnable configuration. Its behavior follows how you opened the builder:
- On a new report, it creates a template (requires the Save Report Templates permission,
app.reports.create, or itsapp.reports.createAllvariant). - On a saved report, it updates that template in place (requires the Update Report Templates
permission,
app.reports.update, or itsapp.reports.updateAllvariant).
So someone who can open a template but not update it simply won't see a save action. To make a copy instead of overwriting, use Duplicate on the Reports list. For the full picture of who can do what, see Reporting permissions.